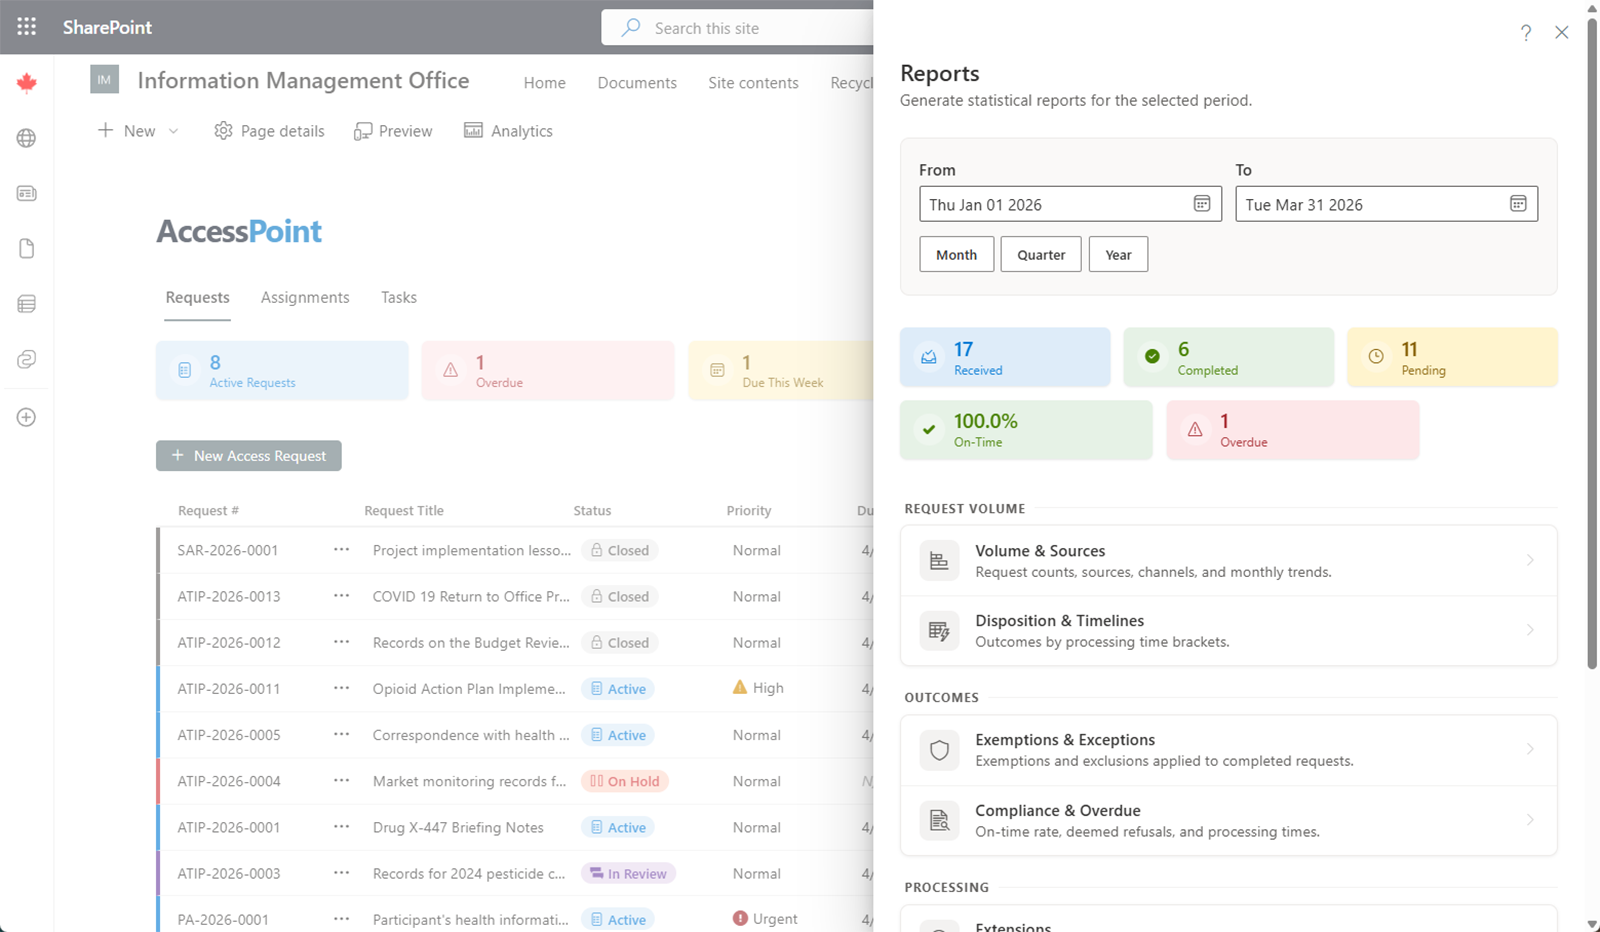
Reports dashboard overview — selecting date ranges, bracket presets, and navigating report sections
Last updated: March 29, 2026 by Steve
Reports
The Reports panel is accessible to SAOs and Administrators and provides statistical insights into request processing across your organization.
Available Reports
AccessPoint includes the following reports:
| Report | Description |
|---|---|
| Volume | Request submission trends by type and requestor category |
| Disposition & Timelines | How completed requests were resolved, cross-tabulated with time brackets |
| Exemptions | Which legal exemptions were applied and how often |
| Compliance & Overdue | On-time completion rates, deemed refusal metrics, and overdue tracking |
| Extensions | Extension frequency, reasons, and duration |
| Consultations | Consultation activity by type and status |
| Complexity & Pages | Request complexity indicators and page counts |
Filtering and Exporting
All reports support:
- Date range selection — choose a custom start and end date or use bracket presets to quickly select common periods
- Export to Excel — download report data for further analysis or external reporting
Select a report from the dashboard to view its details.