Complexity report — page counts, consultation rates, and request complexity indicators
Last updated: March 29, 2026 by Steve
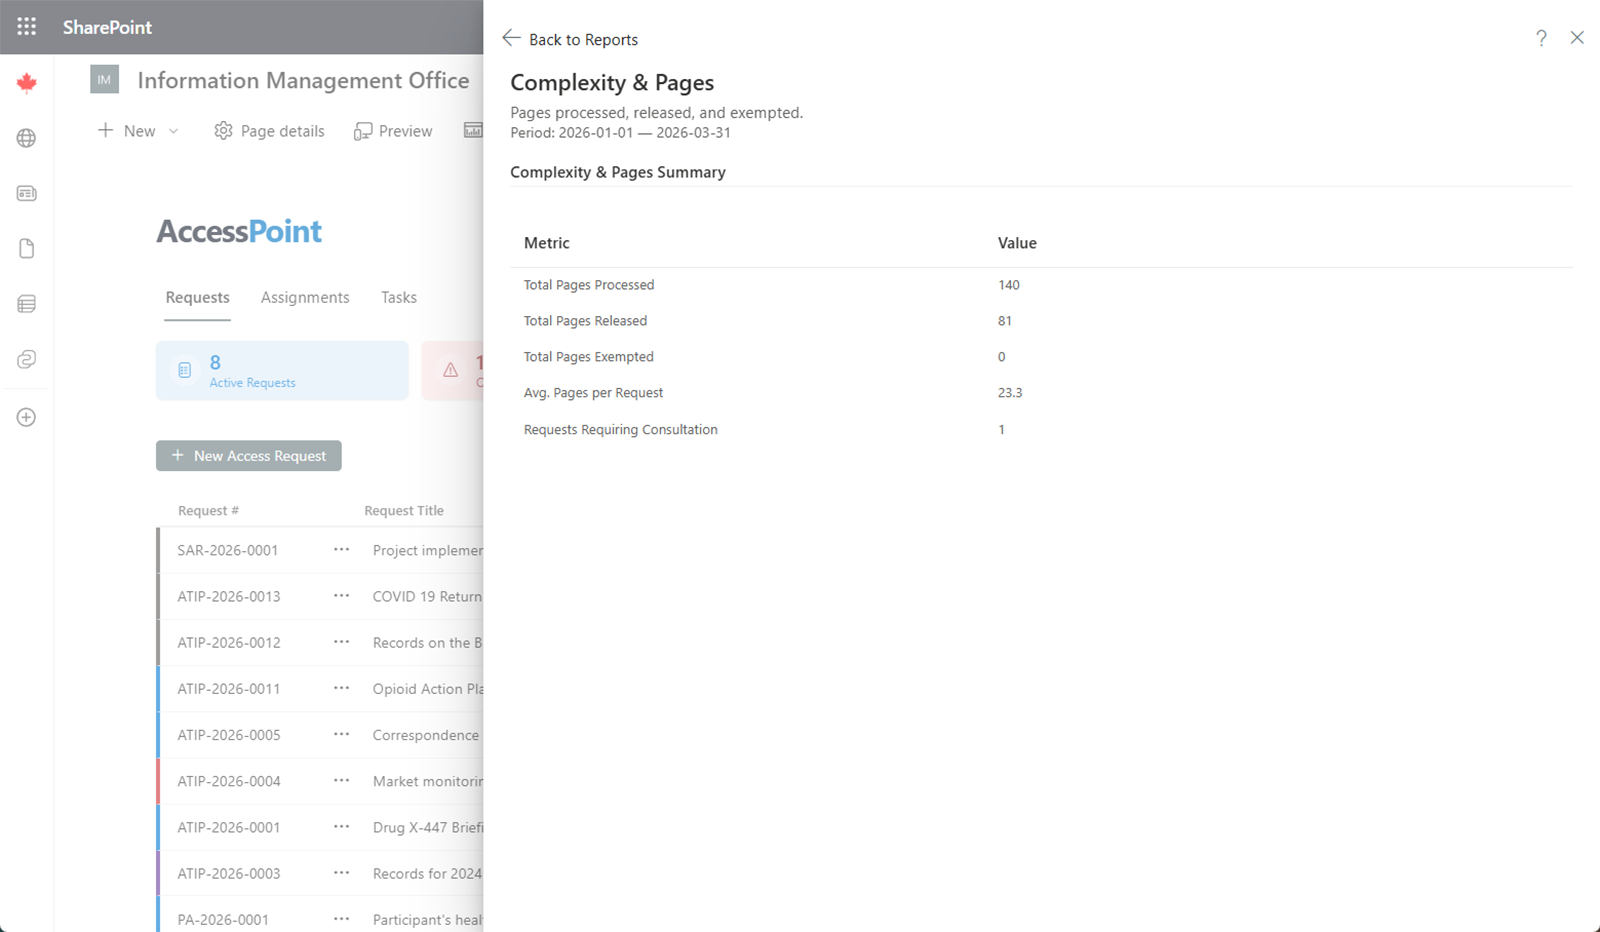
Complexity Report
The Complexity report shows the distribution of requests by complexity level, helping you understand workload patterns and resource needs.
What This Report Shows
This report analyzes complexity indicators across completed requests within your selected date range:
- Page counts — the volume of pages processed per request. Total pages processed uses document page counts when the request-level page count is not set.
- Consultation rates — how often complex requests require consultations
- Complexity indicators — factors that contribute to request difficulty, such as number of repositories searched, exemptions applied, and extensions required
Using This Report
Use the date range selector to adjust the reporting period. Export the results to Excel for further analysis.